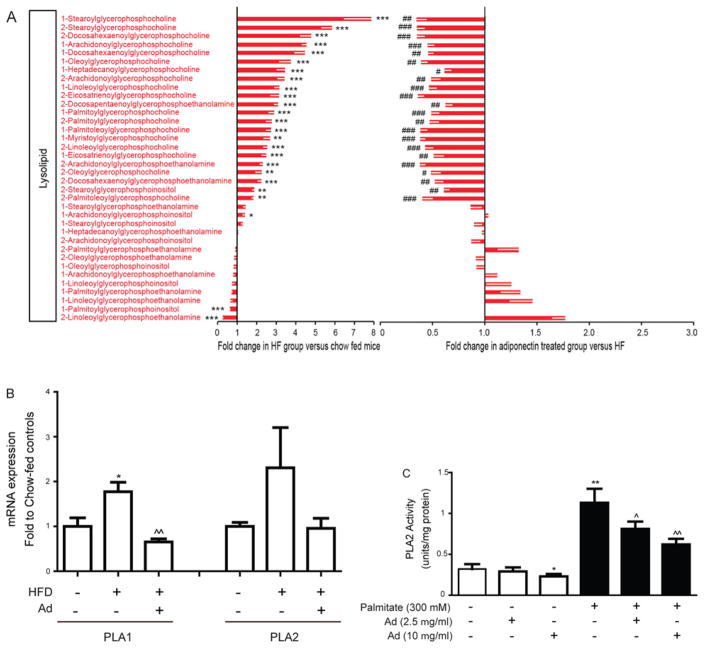
Figure 5. Metabolomic analysis of lysolipid species profiles and analysis of phospholipase activity.
(A) Lysolipid metabolite changes in AdKO mice treated as described in Figure 1. Left panel: fold change between chow- and HFD-fed AdKO mice. Right panel: fold change between adiponectin-and saline-treated HFD-fed AdKO mice. Results are means±S.E.M. *Significant difference between chow and HFD group. #Significant difference between saline-treated and adiponectin-treated HFD group. *#P < 0.05, **##P < 0.01, ***###P < 0.001. (B) The hepatic mRNA expression of PLA1 and PLA2 was analysed in tissue samples from AdKO mouse groups matching data in (A). (C) Primary hepatocytes were isolated and treated without or with palmitate or without or with adiponectin as indicated, and the activity of PLA2 was determined. Results are means±S.E.M. *Significant difference between chow and HFD group or control cell group, #Significant difference between saline-treated and adiponectin-treated HFD groups. *#P < 0.05, **##P < 0.01, ***###P < 0.001.

