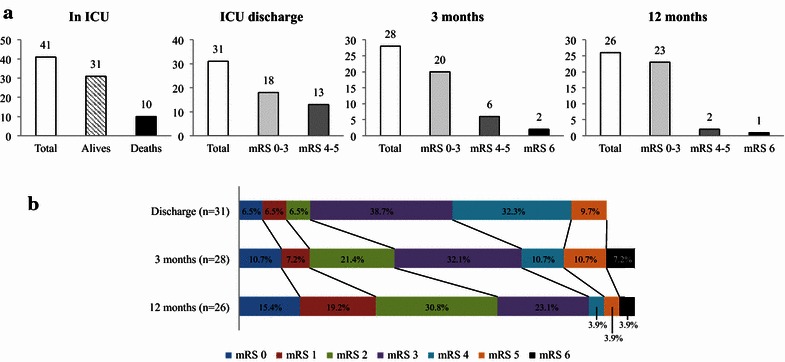
Fig. 2.

Outcome of severe CVT from ICU discharge to the next 12 months. a The evolution of the distribution of patients along the survey period with white bars for the number of the patients. At each period of monitoring (in ICU, at ICU discharge, 3 and 12 months), patients are divided into: group “good recovery” mRS 0–3 (light gray bars), “poor recovery” mRS 4–5 (dark gray bars) and death mRS 6 (black bars). b The distribution of mRS along the survey period at ICU discharge, 3 and 12 months. Proportion for functional ranking was calculated as a ratio between mRS value divided by the number of patients at the time of evaluation. Patients lost after discharge were excluded
