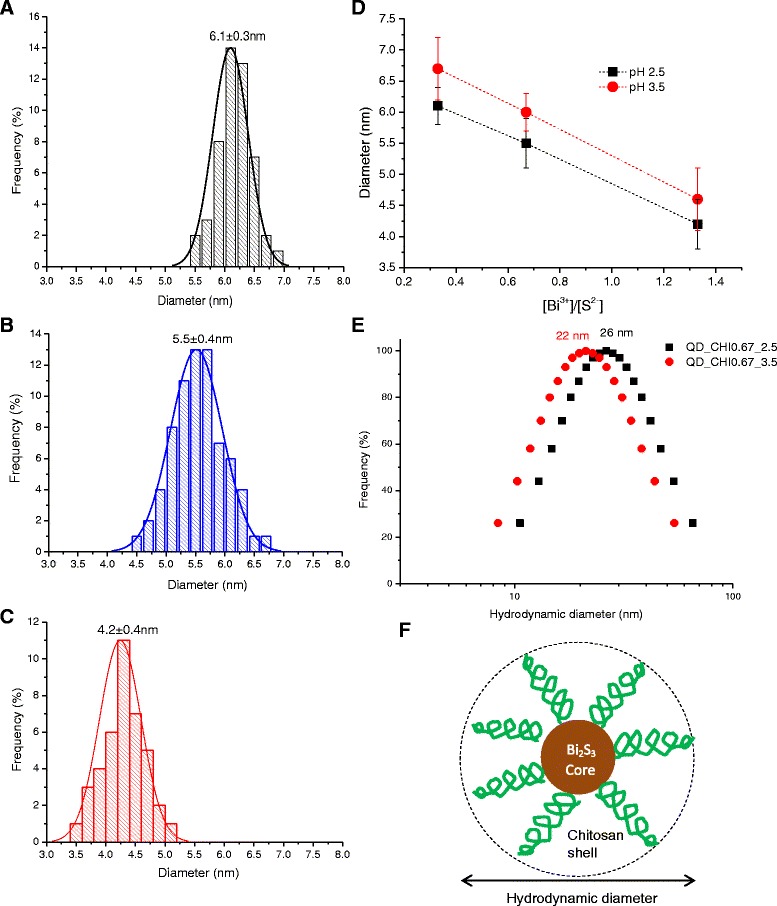
Fig. 3.

Histograms of size distribution of a QD_CHI0.33_2.5, b QD_CHI0.67_2.5, and c QD_CHI1.33_2.5. d Summary of QD diameter as a function of pH (black squares, pH 2.5, and red circles, pH 3.5) and molar ratio of precursors ([Bi3+]/[S2−]). e DLS results for QD_CHI0.67_2.5 (black squares) and QD_CHI0.67_3.5 (red circles). f Schematic representation of core-shell structure of the nanoconjugate (not to scale). A two-column figure
