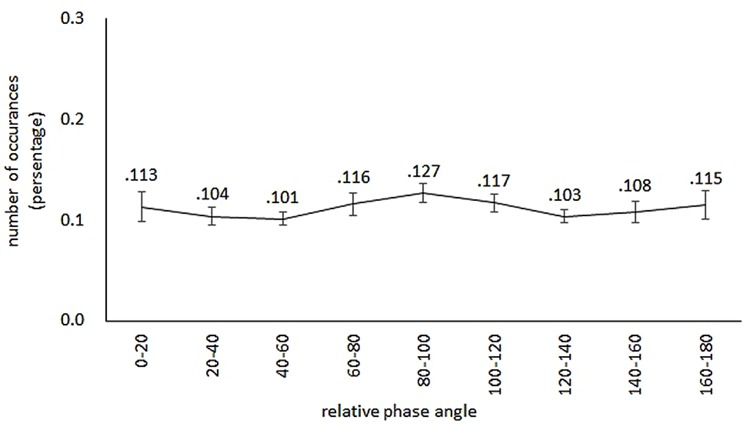
FIGURE 3.

Percentage distribution of relative phase occurrences. The mean value is indicated above the error bar representing the Standard Error. Relative phase is distributed in nine 20° regions from 0 to 180°. The distribution is almost equally spread over the nine regions of the relative phase angle.
