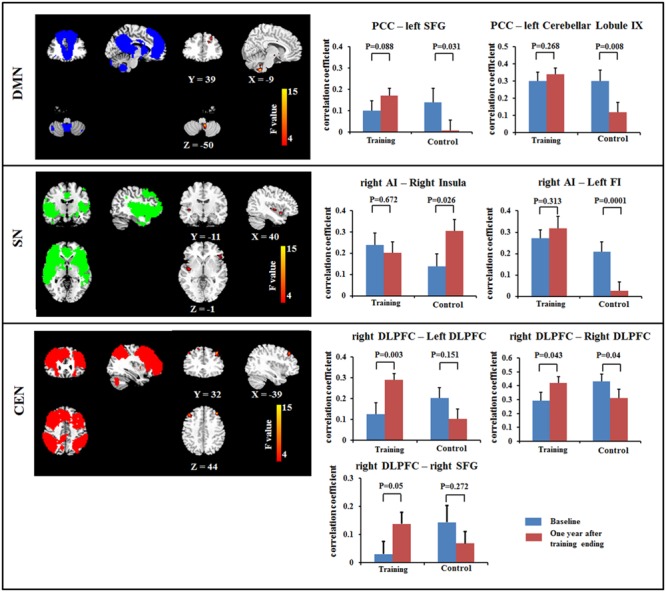
FIGURE 1.

Results of Resting-state functional connectivity (FC) within the DMN (top), within the SN (middle) and within the CEN (bottom) using a voxel-based 2 × 2 repeated ANOVA analysis (p < 0.05, cluster size > 621 mm3). Bars at the right show the mean correlation coefficient of significantly altered FC within networks in training and control groups at the baseline (blue) and 1-year after training ended (red). CEN, Central executive network; DMN, default mode network; DLPFC, dorsolateral prefrontal cortex; FI, frontoinsula; PCC, posterior cingulate cortex; SFG, superior frontal gyrus; SN, salience network. The left side of the image corresponds to the right side of the subject.
