FIGURE 4.

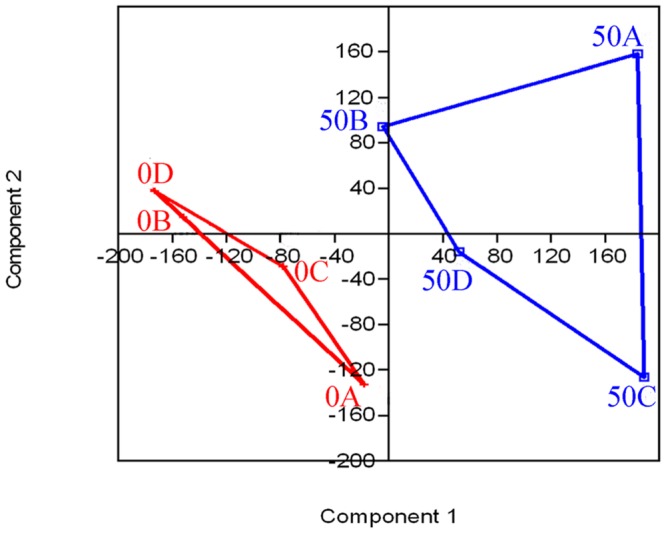
Principal component analysis of the relatedness of PCR-DGGE banding patterns from BAC samples before phenol acclimation (0A, 0B, 0C, and 0D) and from the final enrichment cultures (50A, 50B, 50C, and 50D).

Principal component analysis of the relatedness of PCR-DGGE banding patterns from BAC samples before phenol acclimation (0A, 0B, 0C, and 0D) and from the final enrichment cultures (50A, 50B, 50C, and 50D).