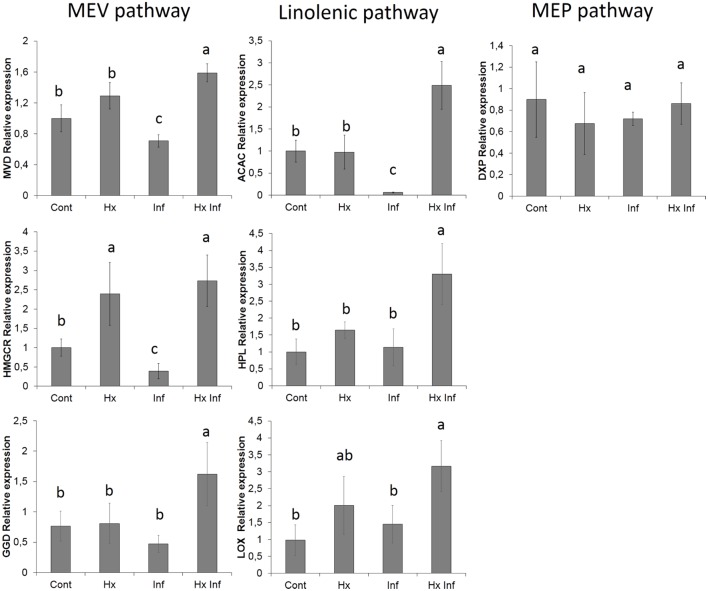
FIGURE 5.
Effect of different treatments on the relative gene expression. Marker genes of MEV pahtway (MVD, HMGCR and GGD), Linolenic pathway (ACAC, HPL and LOX) and MEP pawthway (DXP) Total RNA was isolated from leaves at 96 h post-inoculation and was converted into cDNA and subjected to an RT-qPCR analysis. The results were normalized to the GAPDH/FBOX gene expression measured in the same samples. The data show the average of three independent experiments ± SE. Letters indicate statistically significant differences (P < 0.05; least-significant difference test).

