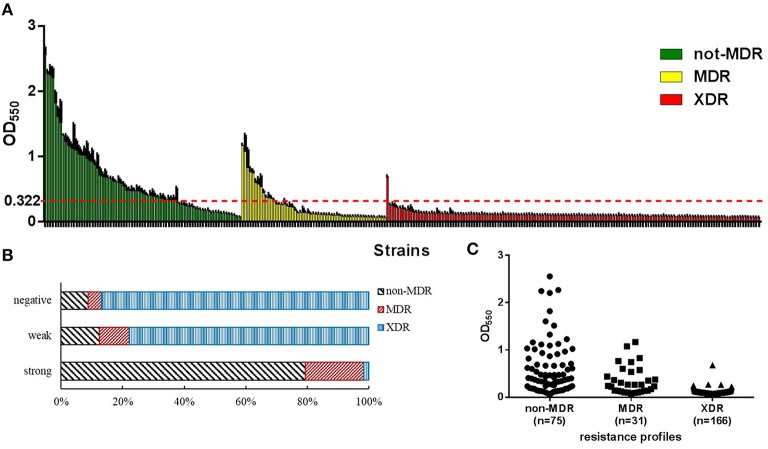
Figure 2.
Biofilm formation of A. baumannii isolates examined in this study. OD550, optical density at 550 nm, represents biofilm forming capacity. (A) The level of biofilm formation was assessed for each isolate. Strains were divided into three groups according to their antibiotic resistance phenotypes: non-multidrug-resistant (non-MDR), multidrug-resistant (MDR), and extensively drug-resistant (XDR). The red line shows the optical density at 550 nm (OD550) of the biofilm biomass produced by the reference strain (ATCC 19606). Larger proportion of non-MDR isolates tended to form stronger biofilms (higher OD550 values). (B) Distribution of resistance phenotypes among different biofilm production capacities displayed as a percentage stacked bar graph. Population that exhibited more robust biofilm formation likely contained larger proportion of non-MDR isolates. (C) Distribution of biofilm formation of isolates with different resistance phenotypes. Isolates with higher level of resistance tended to form weaker biofilms.

