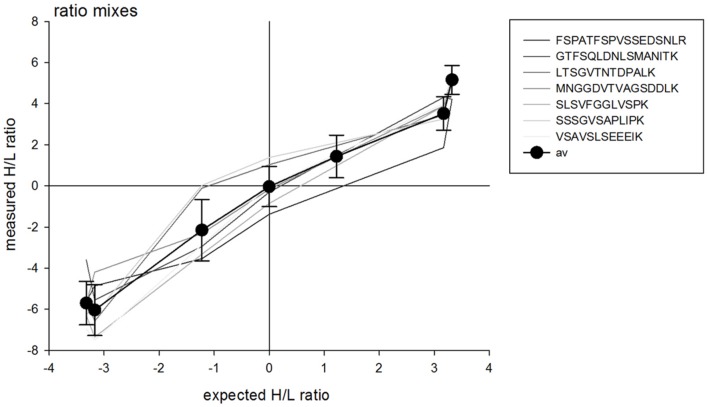
FIGURE 1.
Measured heavy (H) to light (L) ratio of different mixing ratios of labeled (H) and unlabeled (L) QconCAT. A total of 5 μg was injected for each mixture. Differently shaded lines indicate the measured ratios for individual peptides of the QconCAT, black circles indicate the averages across all peptides with standard deviation.

