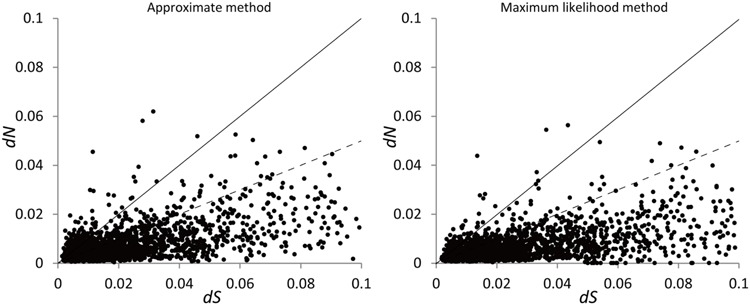
FIGURE 2.

Distribution of dN and dS for the 3,049 pairs of putative orthologous genes estimated using the approximate method with the program yn00 and maximum likelihood method with the program codeml. The pairs with ω > 1 fall above the solid line while those with ω < 0.5 fall below the dashed line. The pairs with dS > 0.1 are not shown.
