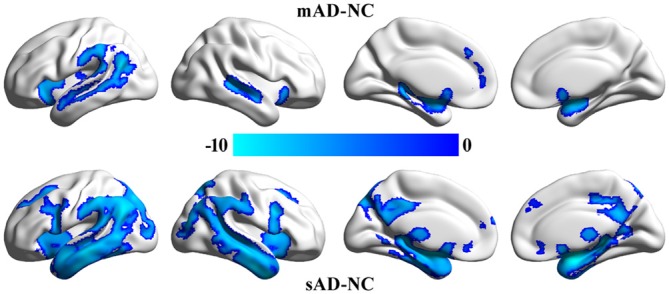
Figure 2.

Significant differences in gray matter volume between the patients and the healthy control group. The whole brain voxel-wise two-sample t-tests were used to identify the significant differences in gray matter volume between mild cognitive impairment (MCI), mild Alzheimer’s disease (mAD), seve AD (sAD) and healthy control groups. The statistic results were corrected using family wise error (FWE) correction method (p < 0.05, FWE corrected).
