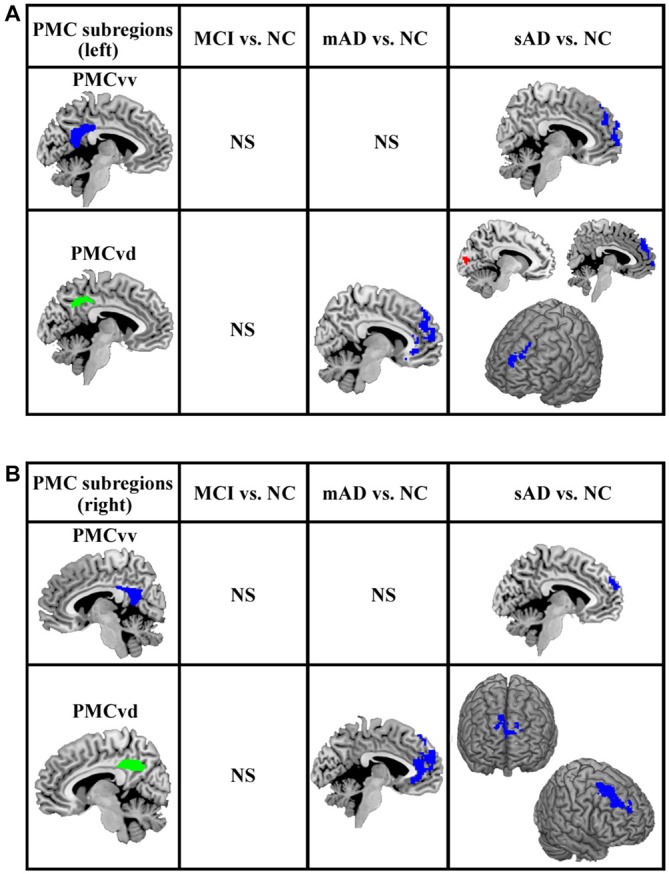
Figure 3.

The overlapped brain areas with significant differences in functional connectivity between the analyses with and without global signal regression. Two-sample t-tests were used to identify the significant differences in functional connectivity between MCI, mAD, sAD, and healthy control groups. The significance was determined with a cluster-level corrected threshold of p < 0.05 (cluster-forming threshold at voxel-level p < 0.01 using the AlphaSim). (A) The changed functional connections for left PMC subregions were found under the analyses with and without global signal regression. (B) The changed functional connections for rihg PMC subregions were identified under the analyses with and without global signal regression. The first column shows the subregions of PMC for assessing the functional connectivity. The second, third and fourth columns show alterations in the MCI, mAD and sAD groups, respectively, compared with the healthy control group. Hot (red tones) and cold (blue) colors represent increased and decreased functional connectivity in the patient group compared with the healthy control group. NS, not significant.
