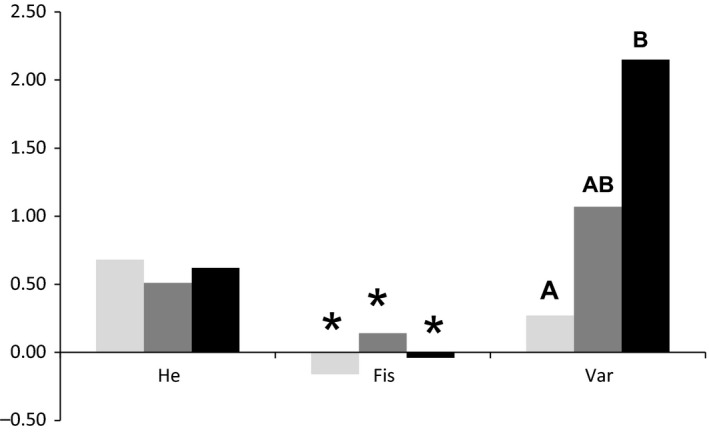
Figure 1.

Summary of relative estimates of diversity (expected heterozygosity of the time sample, H e), inbreeding coefficient of the time sample (F is) and variance among individuals within samples in number of heterozygote loci (Var). Stars (*) indicate estimates significantly different from zero. Different letters show significant differences in the variance in number of heterozygote loci/individual based on 10 microsatellite loci. Different shades of gray mean year of sampling, light gray = 1837, gray = 1930, black = 2011.
