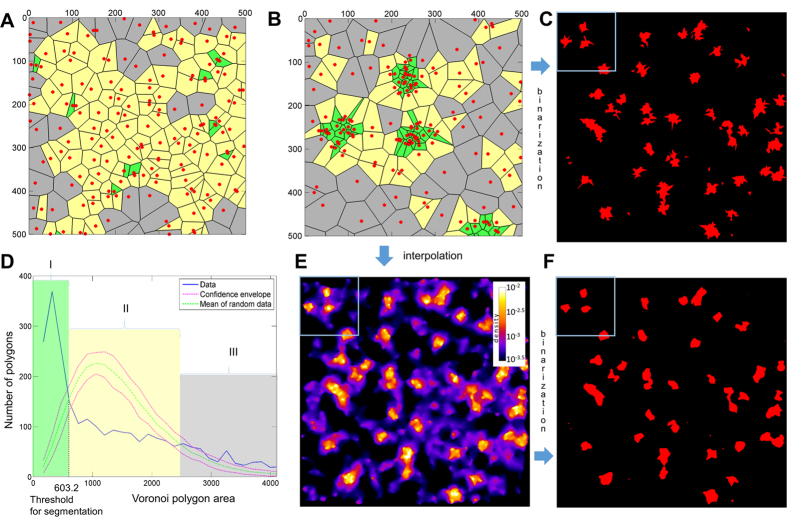
Figure 2. Principle of Voronoi-based image segmentation which allows visualization and quantification of clusters.
(A) A region of simulated pointillist data with random distribution. (B) Simulated clustered distribution of the same number of points as in the random dataset. (C) Clustering obtained after direct segmentation of the Voronoi diagram allowing visualization of the clusters. (D) Distribution of Voronoi polygon areas of the clustered dataset (blue) and mean Voronoi polygon distribution of a random dataset (green) with confidence envelope (red) obtained from Monte-Carlo simulations which allows defining a threshold value for automated segmentation. The three characteristic regions: small clustered polygons (I, green); intermediate polygons corresponding to the random distribution (II, yellow); huge polygons corresponding to background in the clustered distribution (III, gray). (E) Interpolation of the local densities to pixel grid produces local density map. (F) Clusters, obtained by thresholding of the density map. The simulated dataset contained 48 clusters with a radius of 50 nm consisting of ~27 events each. After segmentation, the Voronoi tessellation allows quantification of the clusters (35 were detected, excluding small clusters that contained only one localization event, with 29 ± 16 events each and with equivalent radius of 49 ± 11 nm). The blue frames in (C,E,F) correspond to the region shown in panel (B).

