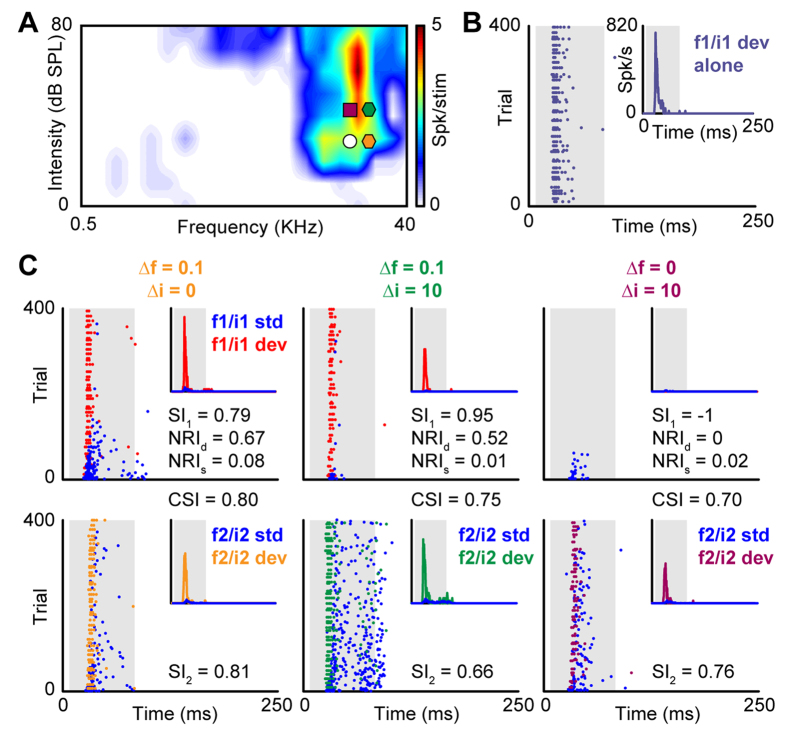
Figure 3. Single-neuron example of frequency, intensity and double oddball responses and corresponding SSA indices.
(A) FRA of the neuron together with stimuli, plotted as in Fig. 1A. (B) Dot raster plot showing the neuron’s responses to the low-frequency/intensity sound (f1/i1; white circle in (A)) in the deviant-alone protocol. The inset shows the corresponding PSTH. The gray-shaded background indicates the timing of the stimulus. (C) Dot raster plots showing the neuron’s responses to the low-frequency/intensity sound (top row) when presented as standard (blue) or as deviant (red; see legend in leftmost panel) in the frequency oddball paradigm (left panel; orange hexagon in (A), the double oddball paradigm with Δf = 0.1 and Δi = 10 dB (right panel; green hexagon in (A) and the intensity oddball paradigm with Δi = 10 dB (right panel; burgundy square in (A). As reference, in the bottom row we show the responses to the high-frequency/intensity sounds (f2/i2) when presented as standard (blue) or as deviant (orange, green or burgundy). All PSTHs shown in this figure have been normalized to the f1/i1 deviant-alone response and are thus shown in relative units. The relevant SI1, NRId and NRIs values are also shown in each panel in the top row. The CSI values, calculated by combining the data from corresponding panels in the top and bottom row are shown between the panels. As reference, SI2 value is shown in the bottom row.

