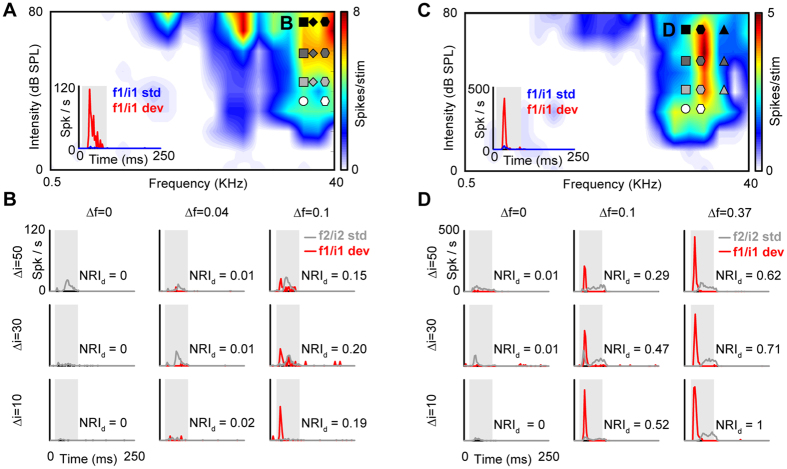
Figure 4. Two example neuron responses to the intensity and double oddball paradigms.
(A,C) FRAs of the two neurons with intensity and double oddball stimuli, plotted as in Fig. 1A. The insets show the PSTHs for the low-frequency/intensity sound (f1/i1; white circle) presented as standard (blue) or deviant (red) in the frequency oddball condition (Δf = 0.1; Δi = 0; see white diamond). (B) PSTHs showing the responses of examples neuron #1 (panel A) to the low-frequency/intensity deviant sound (f1/i1 dev; red line) in nine different intensity and double oddball paradigms, with frequency separations of Δf = 0, 0.04 and 0.1 (rows) and intensity differences of Δi = 10, 30 and 50 dB (columns). For comparison, the gray lines show the corresponding high-frequency/intensity standard responses (f2/i2 std). (D) PSTHs showing the responses of examples neuron #2 (panel C) to the low-frequency/intensity deviant in nine different intensity and double oddball paradigms. In this case, the frequency separations were Δf = 0, 0.1 and 0.37.

