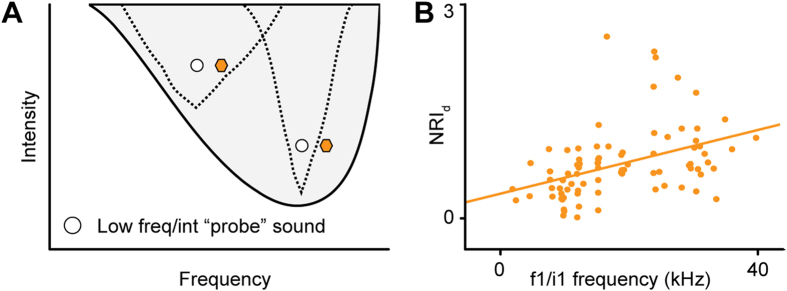
Figure 7. Adaptation specificity decreases with increasing frequency.
(A) Schematic FRA showing the adaptation channels (dashed lines) for two frequency oddball conditions (white and colored symbols), one where the low-frequency/intensity sound (white circle) is set at a low frequency (left) and where it is set at a higher frequency (right). (B) Relationship between the NIAd values in the frequency oddball paradigm (Δf = 0.1, Δi = 10 dB) and the frequency of the low-frequency/intensity sound (f1/i1 frequency). The solid line shows the regression line.

