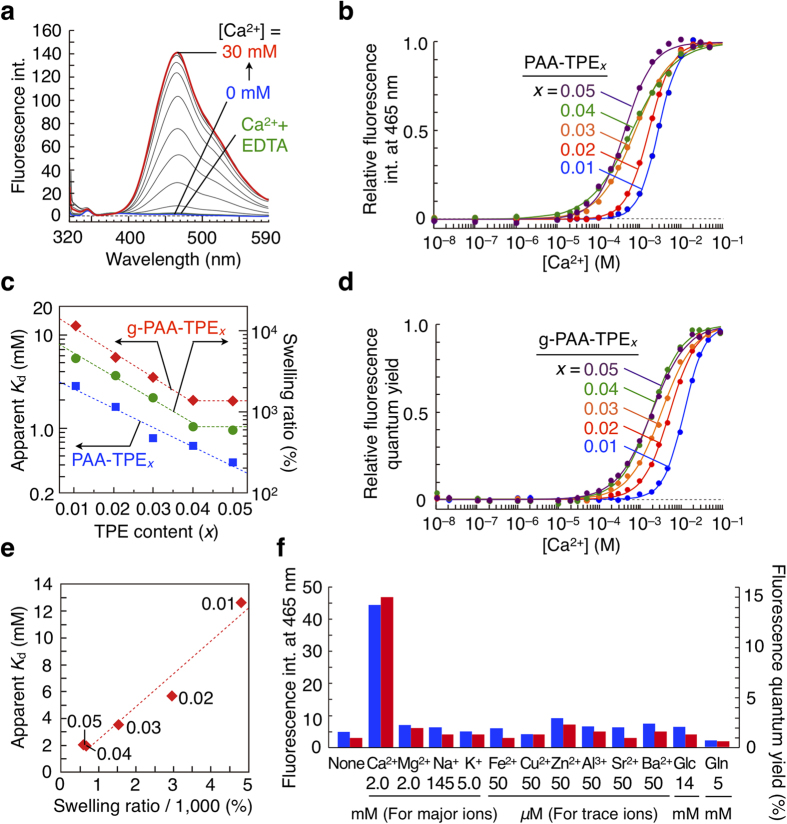
Figure 3. Ca2+-sensing properties of PAA-TPEx and g-PAA-TPEx.
(a) Fluorescence spectral changes of PAA-TPE0.02 (10 mg/L) in a HEPES buffer solution (70 mM, pH = 7.4) at 25 °C upon addition of CaCl2 (blue: 0 mM → red: 30 mM), and after further addition of EDTA (green: 30 mM). The wavelength of absorption maximum (307 nm) due to the TPE chromophore is essentially unchanged upon addition of CaCl2 (Supplementary Fig. S1). (b) Ca2+ titration curves of PAA-TPEx (10 mg/L) in a HEPES buffer solution (70 mM, pH = 7.4). The relative fluorescence intensity is defined as (F–Fmin)/(Fmax–Fmin), where F, Fmax and Fmin represent observed, maximum and minimum fluorescence intensities, respectively. (c) Plots of the logarithms of the apparent Kd values of PAA-TPEx (blue) and g-PAA-TPEx (red) versus TPE contents, and plots of the logarithms of the swelling ratios of g-PAA-TPEx (green) versus TPE contents. (d) Ca2+ titration curves of g-PAA-TPEx (5 mg) in a HEPES buffer solution (70 mM, 5 mL, pH = 7.4). (e) Plot of apparent Kd of g-PAA-TPEx versus the swelling ratio. (f) Fluorescence intensities of PAA-TPE0.02 (blue bars) and fluorescence quantum yields of g-PAA-TPE0.02 (red bars) in the presence of various metal chlorides, glucose (Glc, 14 mM) and glutamine (Gln, 5 mM). [CaCl2] = [MgCl2] = 2 mM, [NaCl] = 145 mM, [KCl] = 5 mM, [FeCl2] = [CuCl2] = [ZnCl2] = [AlCl3] = [SrCl2] = [BaCl2] = 50 μM.

