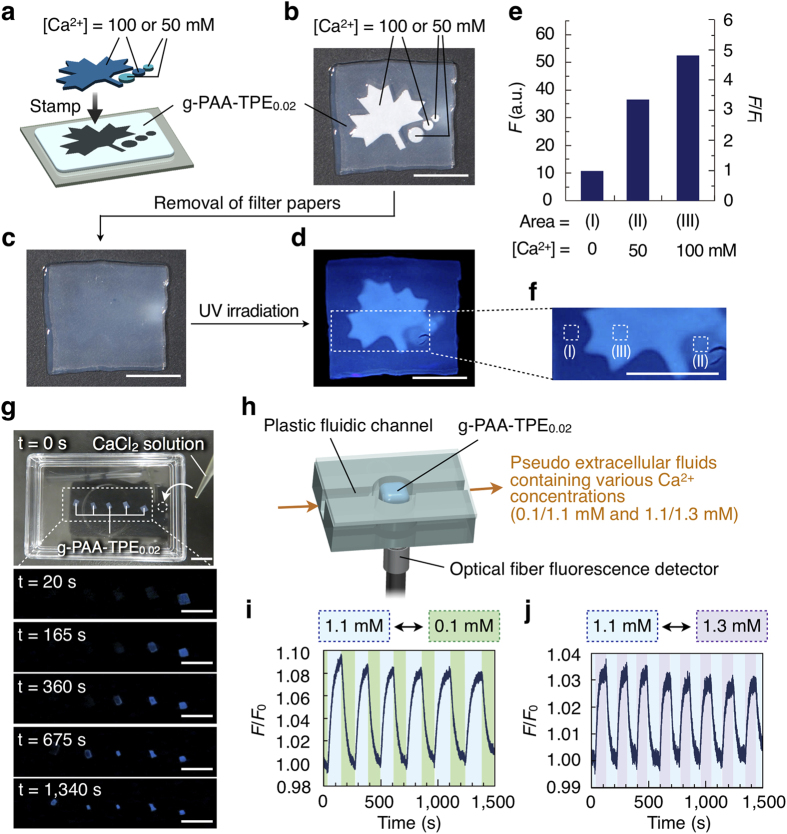
Figure 5. Spatiotemporal Ca2+-sensing capability of g-PAA-TPEx.
(a) Schematic illustration of the stamp experiment using filter papers impregnated with CaCl2 aqueous solution: filter papers impregnated with either 50 or 100 mM CaCl2 solution were put on a gel sheet of g-PAA-TPE0.02. (b–d,f) Pictures of each experimental step: attachment of the gel to the filter papers (b), the gel sheet after removal of the papers (c), a fluorescent image under UV irradiation (d) and its magnification (f). Scale bars, 1.0 cm. (e) Fluorescence intensities (F; average brightness per area) and increasing ratio (F/FI) of three different areas of g-PAA-TPE0.02: (I) filter paper-non-attached area (background), (II) 50 mM CaCl2-attached area and (III) 100 mM CaCl2-attached area shown in (f) FI represents fluorescence intensity of area (I). Scale bars, 1.0 cm. (g) Real-time fluorescence Ca2+ imaging with g-PAA-TPE0.02. Five gel sheets of g-PAA-TPE0.02 were immobilized on a Petri dish. An aqueous solution of CaCl2 (100 mM, 200 μM) was dropped at the right side of the rightmost gel and the time course of changes in the fluorescence of the gel sheets was monitored. Scale bars, 1.0 cm. (h) Schematic illustration of the experimental setup for continuous monitoring of changes in the Ca2+ concentration using g-PAA-TPE0.02. (i,j) Temporal changes in the fluorescence intensity of g-PAA-TPE0.02 in response to alternating changes in the Ca2+ concentration (1.1/0.1 mM and 1.1/1.3 mM for i and j, respectively) in a flowing pseudo artificial extracellular fluid (6.7 mL/min) containing Na+ (145 mM), K+ (5 mM), Mg2+ (2 mM) and glucose (14 mM). F and F0 represent observed and initial fluorescence intensities, respectively. The small fluorescence decay of g-PAA-TPE0.02 upon prolonged UV irradiation is likely due to a photoreaction of the TPE units48.

