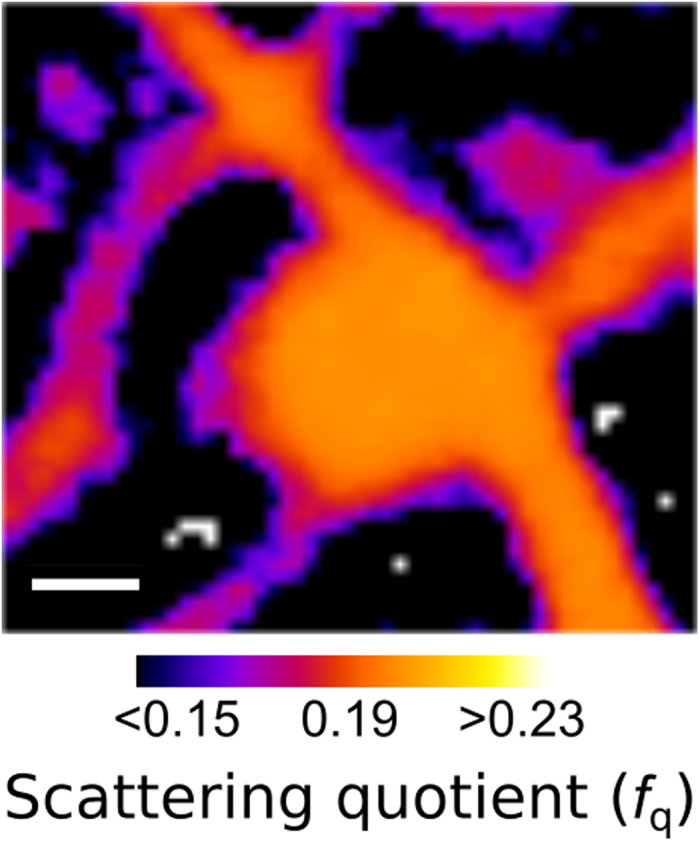
Figure 3.

The scattering quotient map of aggregate (b) and filopodia identified in Fig. 2 (ii - inset). Here we can see that the scattering quotient of the aggregate and filopodia is approximately equal to 0.20, corresponding to a mix a protein and lipids. Scale bar equals 200 nm.
