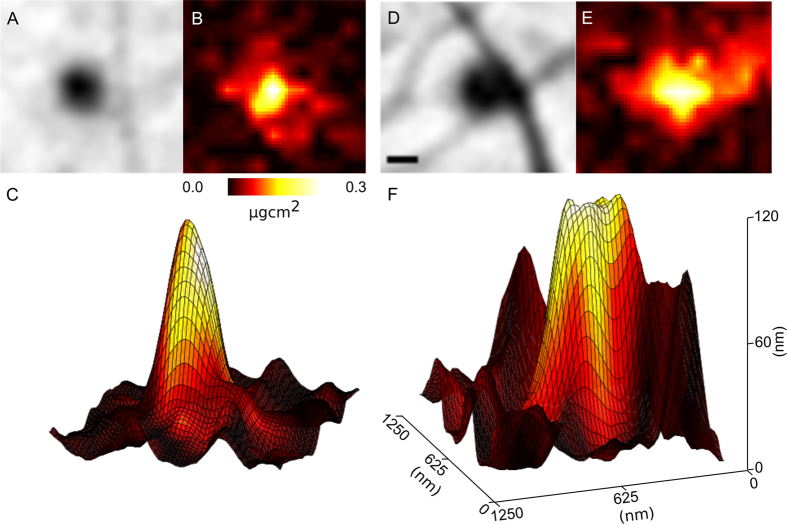
Figure 5.
(A,B,D,E), phase and areal density of Ca of aggregates of biological material at bent filopodia identified in Figs 2 and 3 as i and ii. (C,F) Represent the calculated thickness of the biological aggregate with the colour of the surface mapped to the areal density of Ca (B,E). From these images, we can see the volume of biological material that gives rise to the Ca signal, and use this information to determine the molar concentration of Ca in each aggregate. The scale bar in A is equal to 200 nm, while the vertical axis in (C) refers to the thickness of protein in (C,F).

