Figure 2.
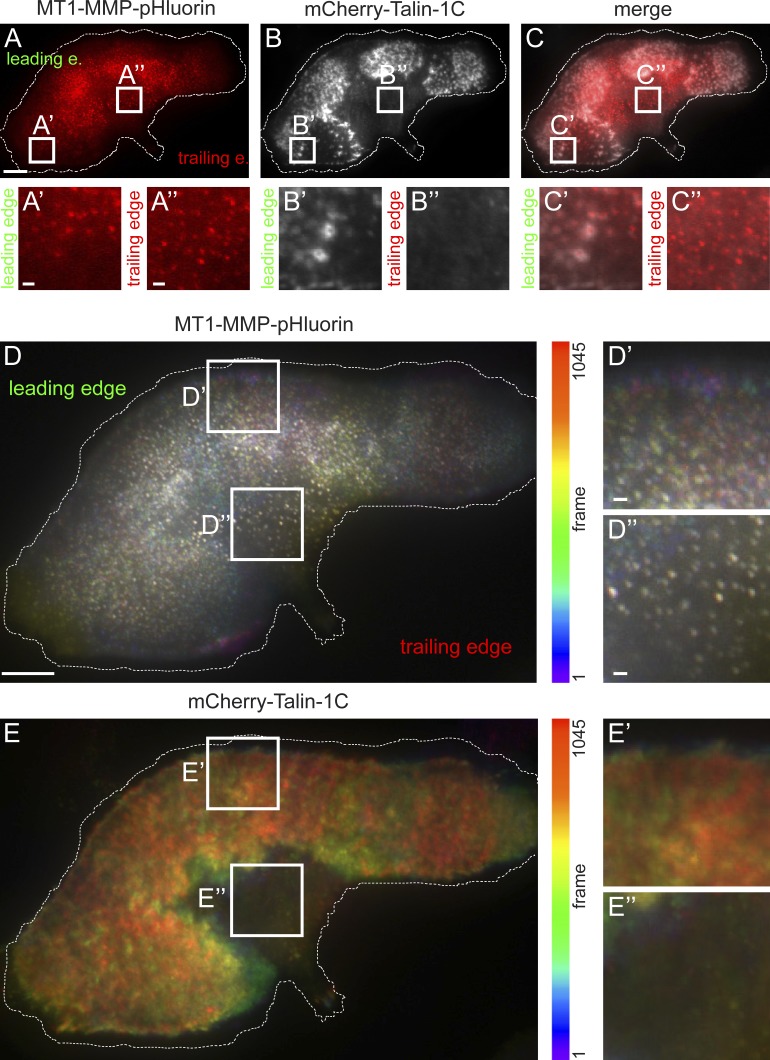
Surface-exposed MT1-MMP is present at podosomes and at podosome-free islets. (A–C) TIRF micrographs of macrophage expressing MT1-MMP-pHluorin (A, red) and mCherry-Talin-1C (B, white), with merge (C). White boxes indicate two detail regions, in which MT1-MMP is associated with podosomes (left box) and present at podosome-free islets (right box). Leading and trailing edge (e.) are indicated. (D and E). Color-coded analysis of cell shown in A–C for visualization of motile versus static structures. For both fluorescence channels (MT1-MMP-pHluorin [D] and mCherry-Talin-1C [E]), each frame was colored along the spectrum, with subsequent merge into a single image. White boxes indicate detail regions also shown enlarged below. mCherry-Talin-1C presents in varying colors, indicating regular podosome ring dynamics (E′), whereas podosome-free areas show only diffuse background (E″). Podosome-associated MT1-MMP-pHluorin also presents in varying colors, indicative of podosome core dynamics (D′). However, MT1-MMP islets present mostly in white (D″), indicating restricted lateral mobility. Dotted line indicates cell circumference. Bars: 10 µm; (insets) 1 µm.

