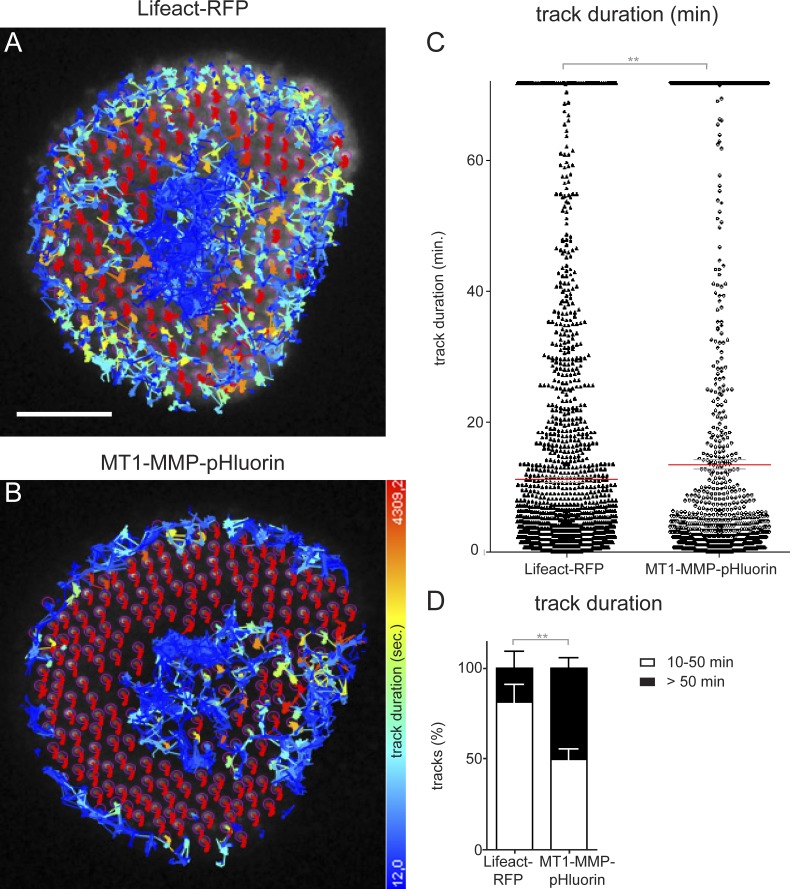
Figure 4.
MT-MMP signals at podosomes persist longer than podosomal F-actin. (A and B) TIRF micrographs of macrophage expressing Lifeact-RFP to detect F-actin–rich podosome cores (A) and MT1-MMP-pHluorin (B). The center of mass of each podosome-associated signal was tracked, and tracks were colored according to their duration, as indicated. (C and D) Statistical analyses of track duration of podosomal F-actin and podosome-associated MT1-MMP. Each dot in C represents track duration of a single podosomal signal. Red bar indicates mean ± SEM. Note higher mean of MT1-MMP-pHluorin signals and also higher amounts of respective signals persisting for >50 min, which is plotted in D as the mean ± SEM percentage of total tracks. **, P < 0.01.

