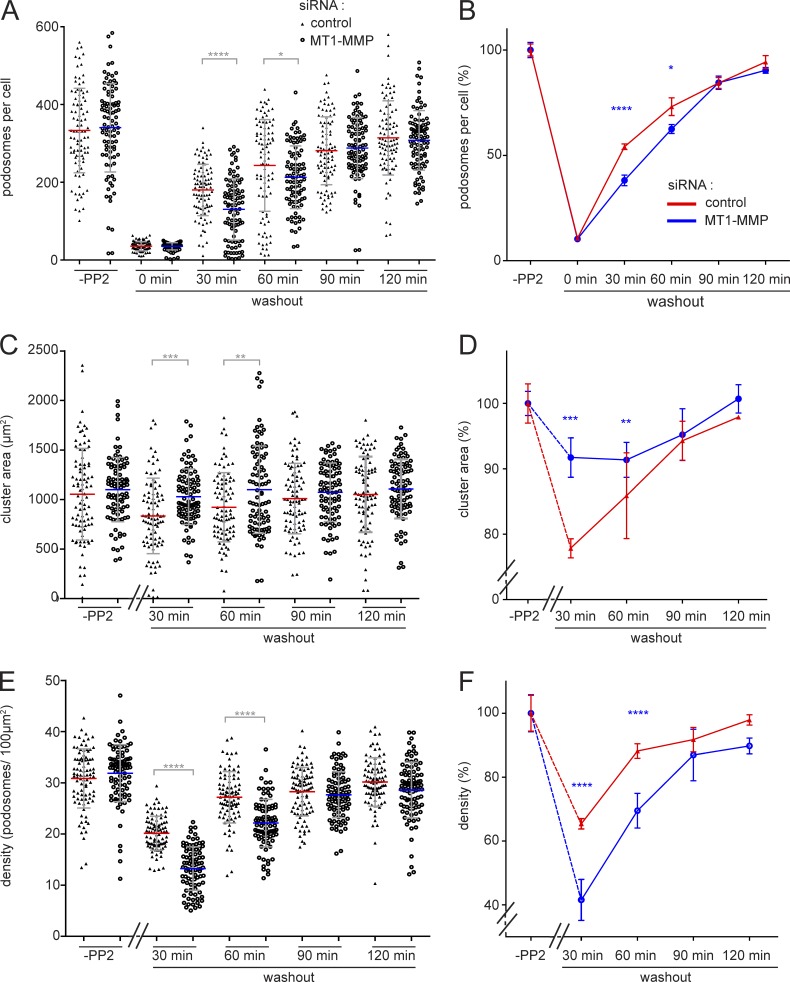
Figure 7.
Podosome reformation proceeds less efficiently in cells depleted for MT1-MMP. Statistical evaluations of podosome numbers (A and B), area covered by podosome groups (“clusters”; C and D), or podosome density (podosomes/100 µm2; E and F) during a podosome reformation assay. Parameters were evaluated in cells before disruption of podosomes (“-PP2”) or after treatment with podosome-disrupting PP2 and washout of the drug for the indicated periods, in cells treated with control siRNA (black triangles) or cells treated with MT1-MMP–specific siRNA (open circles). Each dot in A–C represents a single cell, with n = 3 × 30, for cells from three different donors. Diagrams in B, D, and F show data as respective line diagrams. Podosomes are mostly absent at 0 min of the washout (A); podosome-covered area (B) and podosome density (C) were not evaluated for this time point. Note that podosome density of MT1-MMP–depleted cells is significantly different from controls at 30- and 60-min time points (C). Values are given as means ± SD. *, P < 0.05; **, P < 0.01; ***, P < 0.001; ****, P < 0.0001. For specific values, see Table S2.

