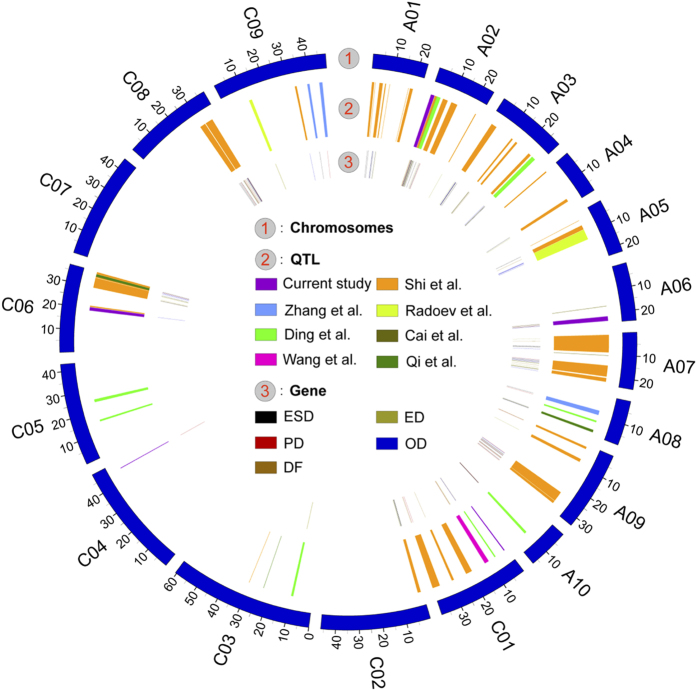
Figure 3. Integration of SNPP QTLs and candidate genes for on the reference genome of Brassica napus.
Concentric circles show the different features that were drawn using the Circos program. 1, 19 chromosomes of rapeseed. 2, Consensus QTLs of SNPP, different colours represent different studies. 3, Genes referred to QTL mapping results for SNPP, ESD (embryo sac development), ED (embryo development), PD (pollen development), OD (ovule development), and DF (double fertilization), which are represented by different colours. QTL mapping range and genes are represented by squares and lines, respectively.

