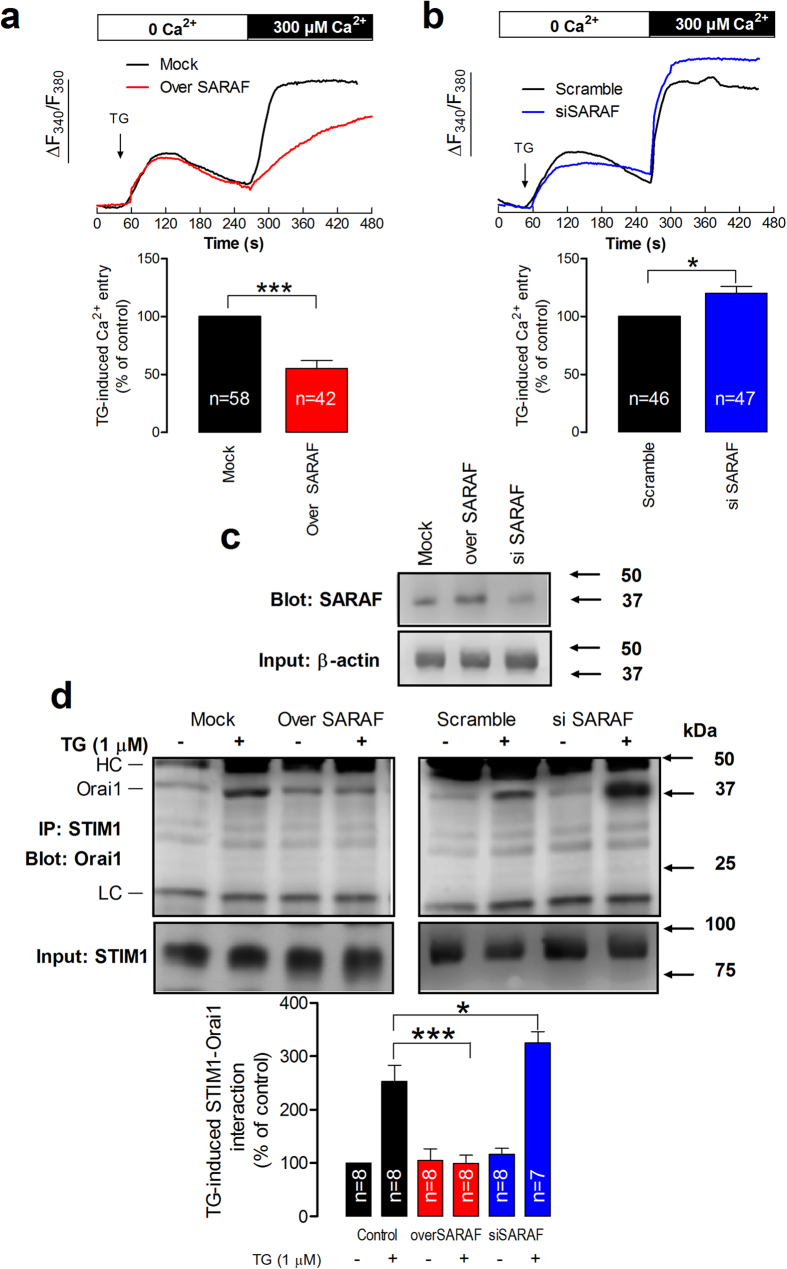
Figure 1. SARAF regulates TG-induced SOCE and STIM1-Orai1 interaction.
(a,b) MEG-01 cells overexpressing SARAF and mock-treated cells (a) or MEG-01 cells transfected with si SARAF or scramble plasmid (b) were perfused with a Ca2+-free medium (100 μM EGTA added) and then stimulated with TG (1 μM) followed by reintroduction of external Ca2+ (final concentration 300 μM) to initiate Ca2+ entry. Data are original traces representative of 42-58 experiments. Values are expressed as described in methods. The bar graph represents TG-induced Ca2+ entry as mean ± SEM and data are presented as percentage of control. (c) Cells overexpressing SARAF, treated with siSARAF and mock-treated cells were lysed and subjected to Western blotting with anti-SARAF antibody, followed by reprobing with anti-actin antibody for protein loading control. (d) MEG-01 cells overexpressing SARAF or transfected with si SARAF and their respective controls were stimulated with TG (1 μM) in a Ca2+-free medium (100 μM EGTA added) and three min later lysed. Whole cell lysates were immunoprecipitated (IP) with anti-STIM1 antibody and immunoprecipitates were subjected to 10% SDS-PAGE and subsequent Western blotting with a specific anti-Orai1 (aa 288–301 (Sigma)) antibody. Membranes were reprobed with the antibody used for immunoprecipitation for protein loading control. The panels show results from one experiment representative of 6–7 others. Molecular masses indicated on the right were determined using molecular-mass markers run in the same gel. HC, heavy chain of the antibody used for immunoprecipitation. The bar graph represents the quantification of STIM1-Orai1 association in resting and TG-treated cells. Results are recorded as arbitrary optical density units, expressed as mean ± S.E.M. and presented as percentage of control. * and *** represent p < 0.05 and p < 0.001, as compared to their respective controls.

