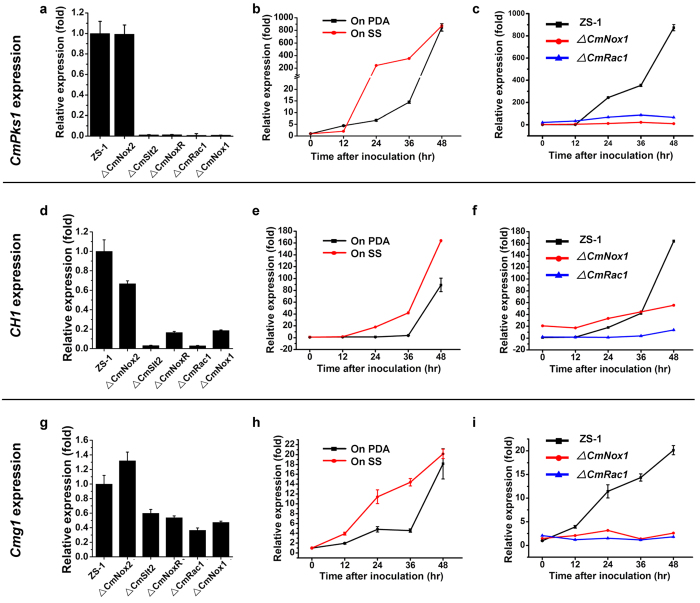
Figure 7. Gene expression analysis in the wild-type strain ZS-1 and deletion mutants of C. minitans.
Relative transcript accumulations of CmPks1 (a), CH1 (d) and Cmg1 (g) detected with qRT-PCR amplification in ZS-1, ΔCmNox2, ΔCmSlt2, ΔCmNoxR, ΔCmRac1 and ΔCmNox1 after growing on PDA for 96 hr. The expression of ZS-1 was set as level one. Relative transcript patterns of CmPks1 (b), CH1 (e) and Cmg1 (h) in ZS-1 after contacting with S. sclerotiorum (red) or growing on PDA (black) for 0–48 hr. The gene expression of ZS-1 inoculated in plate at 0 hr was set as level one. Relative transcript patterns of CmPks1 (c), CH1 (f) and Cmg1 (i) genes in ZS-1 (black), ΔCmNox1 (red) and ΔCmRac1 (blue) after growing on PDA for 0–48 hr. The gene expression of ZS-1 at 0 hr was set as level one. The relative level of transcript was calculated by the comparative Ct method. The level of CmActin transcript was used to normalize different samples. Bars represent means and standard deviations (three replications).

