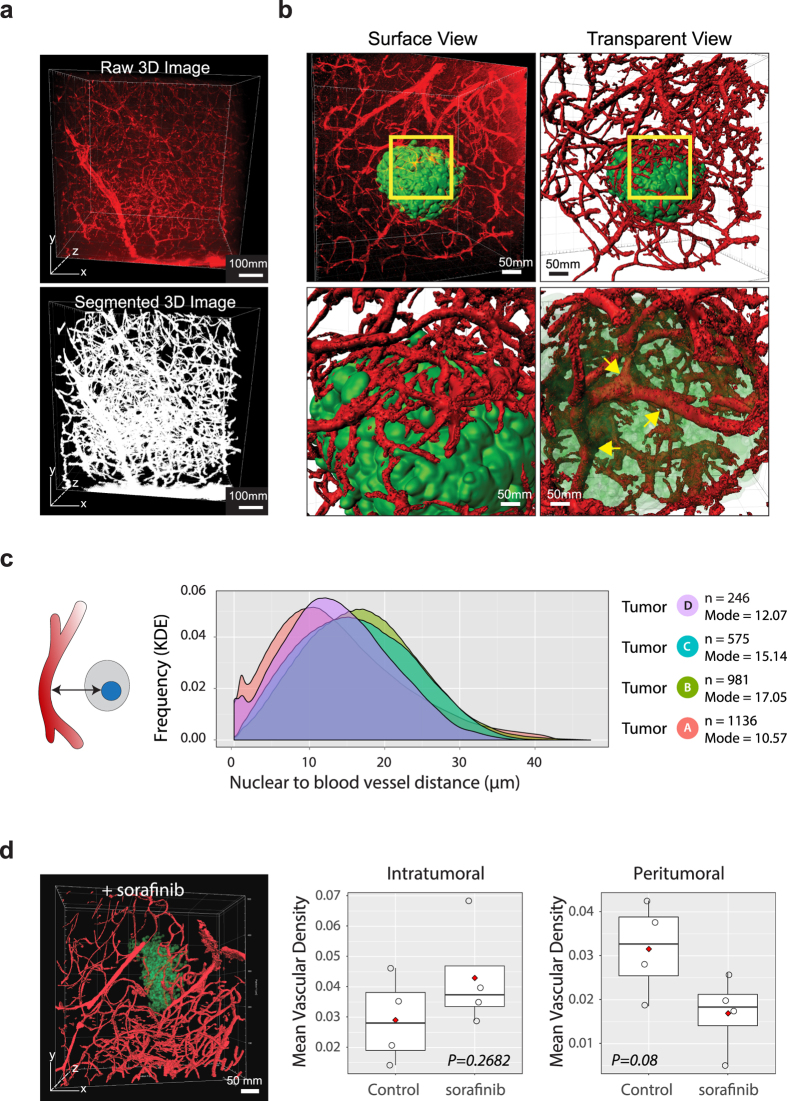
Figure 5. Heterogeneous Spatial and Temporal Vasculature Response to PNA.Met1 Metastases.
(a) 3D multiphoton image of metastasis-associated vasculature (top) and associated 3D segmentation image (bottom). (b) 3D images of metastasis-associated vasculature (red) before (top left) and after (top right) surface generation of vasculature, with a focus on vasculature on metastasis surface (bottom left) and infiltrating vasculature (bottom right). (c) Kernel density estimation (KDE) plot for the distance of each tumor cell voxel to the nearest blood vessel for tumors A, B, C, and D. n: number of tumor cells. (e) Surface generated image of a PNA.Met1 brain metastasis (transparent green) and associated vasculature (red) treated with Sorafenib (left) and plots of the mean vasculature density within the tumor (intratumoral) and outside the tumor (peritumoral) for Sorafenib and control-treated mice. Peritumoral zone = spatial distance within 100 μm from tumor surface.

