
Fig. 2.
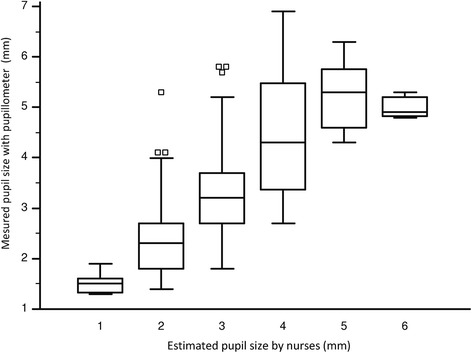
Comparison of pupil size obtained with the pupillometer versus subjective estimates. Box plots indicate medians (horizontal line in box), the 25th and 75th percentiles (lower and upper box margins), the 10th and 90th percentiles (lower and upper error bars), and individual patients in the lower 10th percentiles (open squares) for each visual measurement of pupil size. The short box whisker plots for the 1 mm and 6 mm groups suggest a high level of agreement. Box plots for the 2–5 mm groups are stretched by outliers, suggesting a lower level of agreement between the two measurements for each of these groups