
Fig. 3.
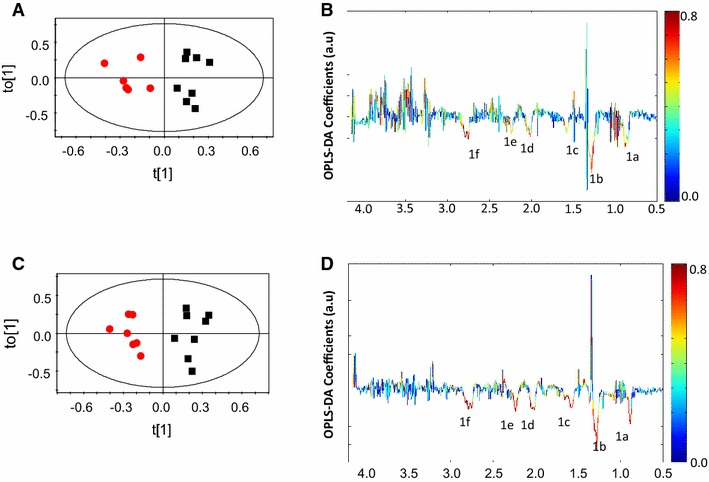
OPLS-DA scores and coefficient plot of CM and NCM at day 4 post infection for experiment 5. A OPLSDA scores plot of CM and NCM for female mice, B OPLS-DA coefficient plot of A, C OPLSDA scores plot of CM and NCM for male mice, D OPLS-DA coefficient plot of C. The red and black symbols denote CM and NCM, respectively. The ellipse in the scores plot is a 95 % Hotelling T2. The colour bar indicates the correlation of the metabolites in the segregation between two concerned classes