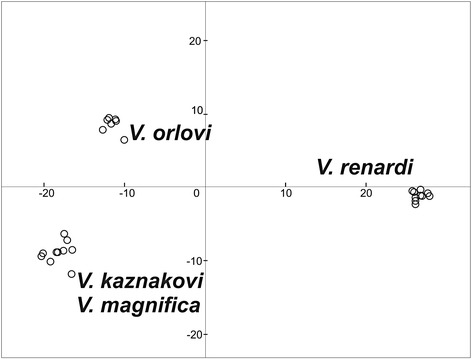
Fig. 4.

Discriminant analysis of principal components (DAPC) results for all ingroup samples. Each sample is plotted based on the first two discriminant functions. Associated clustering analyses identified three groups as the optimal solution, consisting of V. renardi, V. orlovi, and a third group containing V. kaznakovi and V. magnifica
