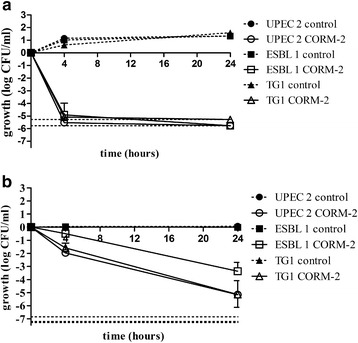
Fig. 3.

The antibacterial effect of CORM-2 in the exponential and stationary growth phase. A comparison of the effect of CORM-2 exposure in the exponential growth phase and in the stationary phase in ESBL isolate 1, UPEC isolate 2 and K-12 strain TG1. a Cultures were grown to early log phase in MS-broth and then exposed to CORM-2 (500 μM) or DMSO (control). b Cultures were grown to stationary phase in MS-broth and then exposed to CORM-2 (500 μM) or DMSO (control). Growth was calculated as the numbers of CFU/ml in treated cultures or controls divided by the number of CFU/ml formed upon the plating of the initial inoculums and expressed as log CFU/ml. The data are presented as mean ± SEM from at least three independent experiments. Lower grids show the detection limit
