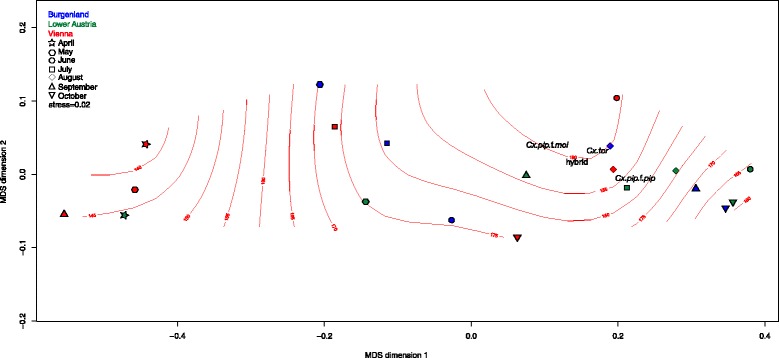
Fig. 1.

Configuration of spatial and temporal fluctuations of Culex spp. communities in eastern Austria in a two dimensional NMDS representation of Bray-Curtis distances. Isolines represent air temperature [°C × 10−1] variability throughout the sampling period modelled in ordination space using a generalized additive modelling approach as implemented in ordisurf(), deviance in ordination space explained = 44.9 %; R2 = <0.01
