
Fig. 2.
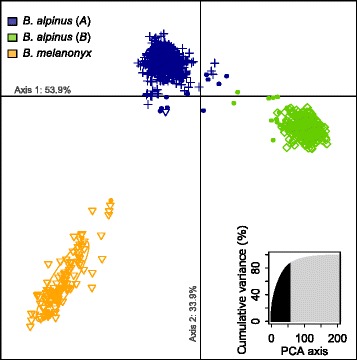
Clustering analysis of multilocus genotypes of 1591 individuals of B. alpinus species group based on 10 microsatellite markers. The DAPC scatterplot shows the first two principal components on the X and Y axes. Each colored dot represents an individual genotype assigned to one of the three clusters by DAPC (colors and ellipses), with symbols corresponding to each genetic group defined by Bayesian clustering analysis of STRUCTURE: B. alpinus lineage A, crosses; B. alpinus lineage B, diamonds; B. melanonyx, triangles. Filled dots indicate admixed individuals with a cluster membership coefficient <0.85 in the STRUCTURE analysis. The number of principal components retained and their cumulative variance explained are highlighted in black in the insert. The proportion of variance captured by the first and second DAPC axes is indicated on each axis