
Fig. 5.
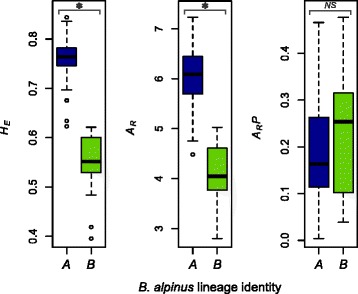
Genetic diversity estimates (expected heterozygosity H E, allelic richness A r , and private allelic richness A r P) for the two B. alpinus lineages A and B. Box-plots indicate the median (horizontal line), the 25th and 75th percentiles (bottom and top of each box), and the minimum/maximum values (vertical dashed lines). * = P < 0.01