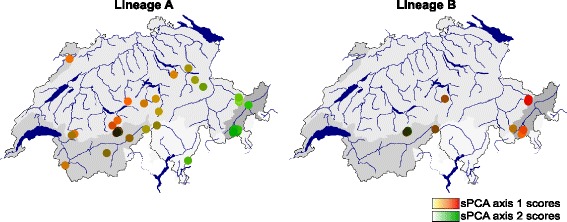
Fig. 7.

Results of spatial principal component analysis on B. alpinus lineages A and B. Each dot synthesizes the first two sPCA principal components (see [80]), which are plotted on a red (sPCA PC1) or green (sPCA PC2) color scale. The color intensity is proportional to the spatial principal component scores so that populations that are more closely related in multivariate space are similar in color
