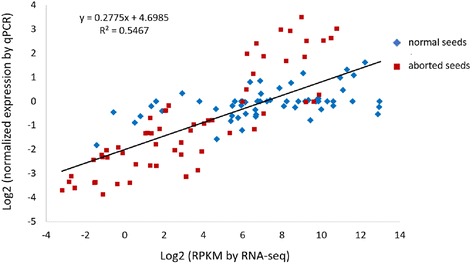
Fig. 12.

Correlation of gene expression results. The x-axis represents the value of Log2 RPKM and the y-axis represents the value of Log2 normalized expression level. Violet diamonds represent normal seeds. Red squares represent aborted seeds. R2 value represent the correlation between RNA-seq and qPCR results
