
Fig. 3.
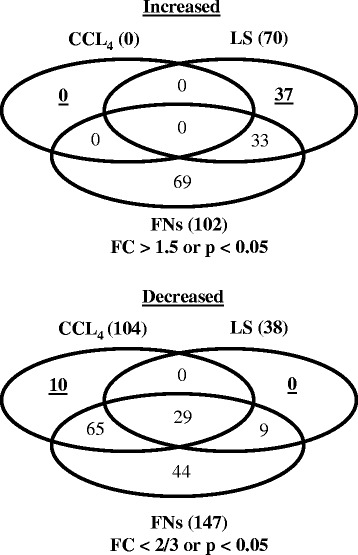
Venn diagrams of the number of lipid molecules that showed significantly different levels between the control and chemical-treated rats (CCl4, LS and non-fibrogenic chemicals for 28 days). Increased: chemical-treated rats > control, decreased; chemical-treated rats < control. CCl4, carbon tetrachloride; FC, fold change; FNs, non-fibrogenic chemicals; LS, lomustine