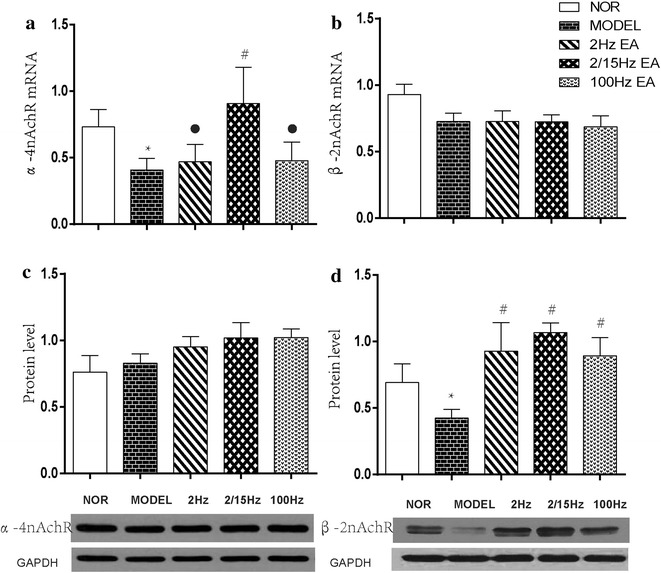
Fig. 3.

Effect of different frequencies of EAS of ST36-GB34 on expression of α4 nAChR and β2 nAChR mRNA and proteins in the hippocampus in neuropathic pain rats (mean ± SD, n = 6 in each group); a α4 nAChR mRNA, b α4 nAChR protein; c β2 nAChR mRNA, d β2 nAChR protein; *P < 0.05, vs the normal group; #P < 0.05, vs the model group; P < 0.05, vs the 2/15 Hz EAS group
