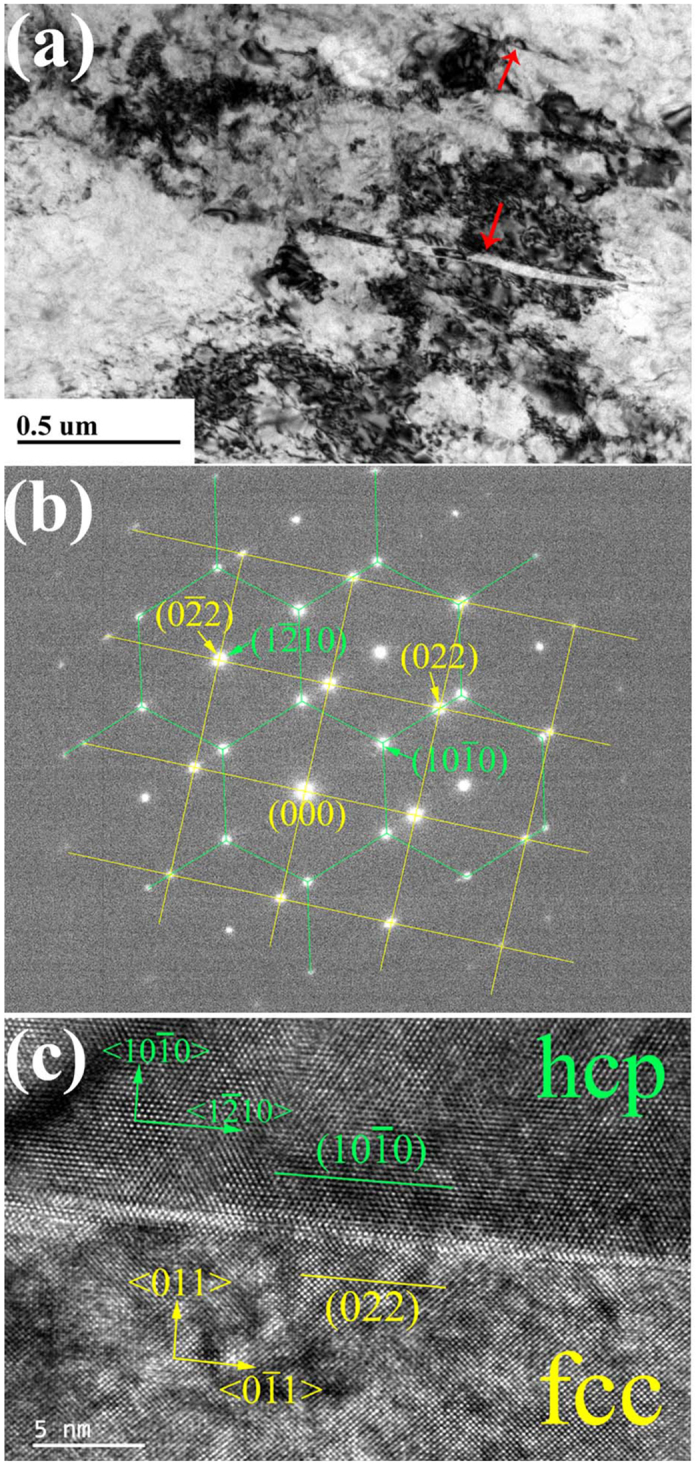
Figure 1. Orientation relationship between hcp matrix and fcc band.

(a) Platelet bands in cold-rolled titanium indicated by red arrows. (b) SAED patterns of the interface between hcp and fcc, where patterns outlined by green lines corresponding to hcp and by yellow lines corresponding to fcc. (c) HRTEM image of the interface showing the orientation relationship to be 〈0001〉hcp||〈001〉fcc and { 0}hcp||{011}fcc.
