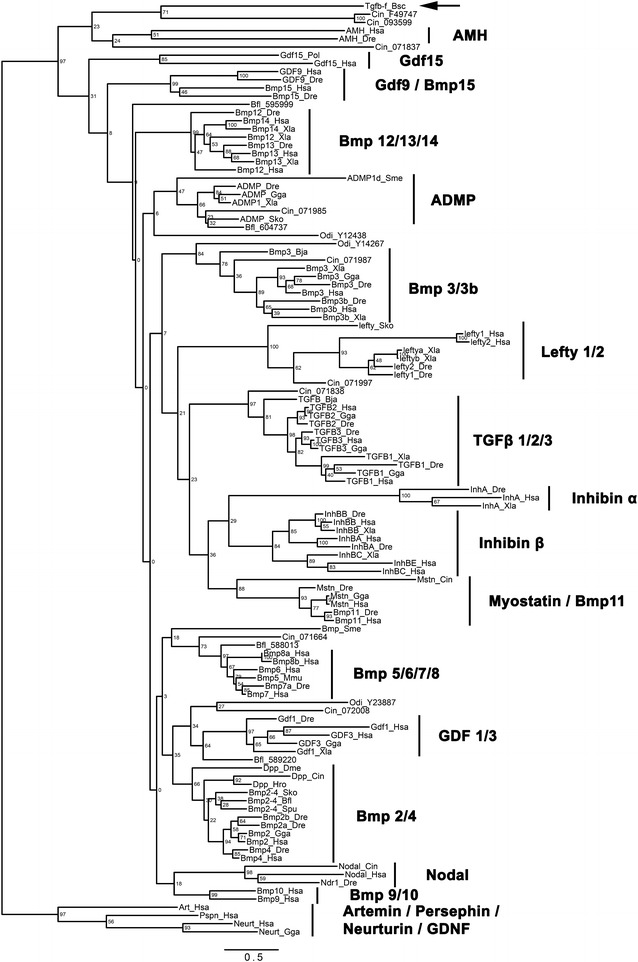
Fig. 3.

Maximum likelihood phylogenetic analysis of Tgfβ-f and other TGF-β family members. Unrooted phylogenetic tree constructed by maximum likelihood analysis using RAxML with 504 replicates for bootstrap, the JTT substitution matrix, and empirical frequencies. Botryllus Tgfβ-f is marked by an arrow. Families of TGF-β proteins are labeled and indicated by vertical lines. Nodes are labeled with bootstrap values in units of percentage. The scale bar for branch lengths indicates the mean number of inferred substitutions per site
