Fig. 2.

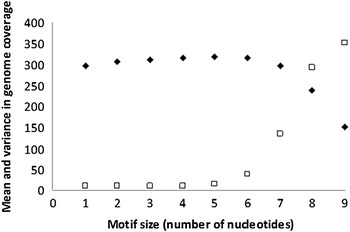
Motif size, mean and variance relation. Mean coverage of the genome is represented as filled squares and variance coverage of the genome is represented as open squares. Variance is divided by 100 for clarity

Motif size, mean and variance relation. Mean coverage of the genome is represented as filled squares and variance coverage of the genome is represented as open squares. Variance is divided by 100 for clarity