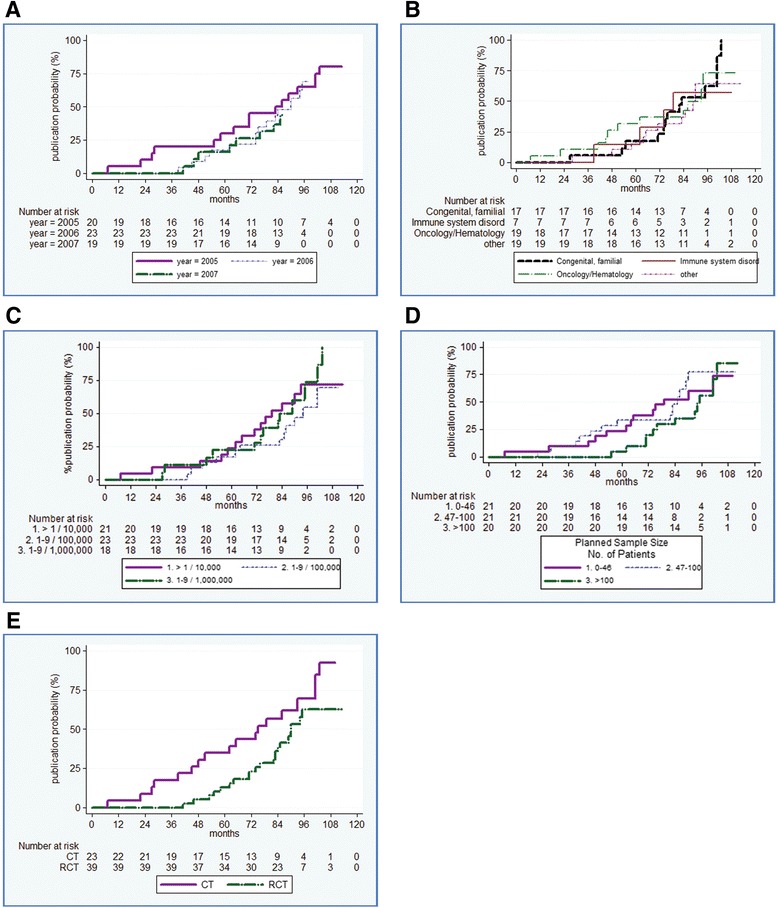
Fig. 3.

Kaplan–Meier Plot of cumulative probability of publication by time (months) since funding agreement in the analyzed cohort by study characteristics: Year, p = 0.8184 (Panel a); Clinical area, p = 0.9112 (Panel b); Disease prevalence, p = 0.3759 (Panel c); Planned sample size, p = 0.3989 (Panel d); Study design, i.e. CT vs RCT, p = 0.0531 (Panel e)
