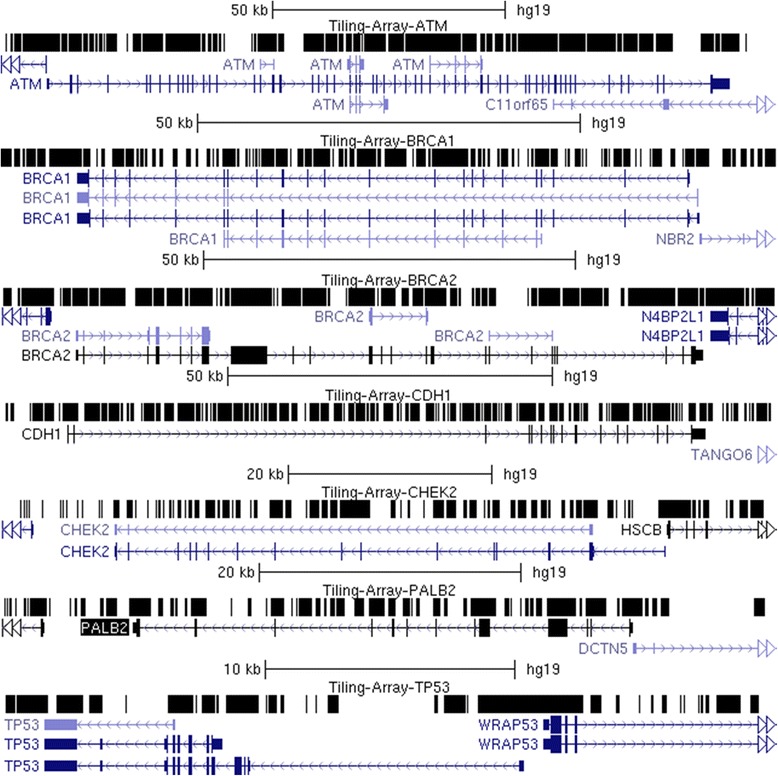
Fig. 1.

Capture Probe Coverage over Sequenced Genes. The genomic structure of the 7 genes chosen are displayed with the UCSC Genome Browser. Top row for each gene is a custom track with the “dense” visualization modality selected with black regions indicating the intervals covered by the oligonucleotide capture reagent. Regions without probe coverage contain conserved repetitive sequences or correspond to paralogous sequences that are unsuitable for probe design
