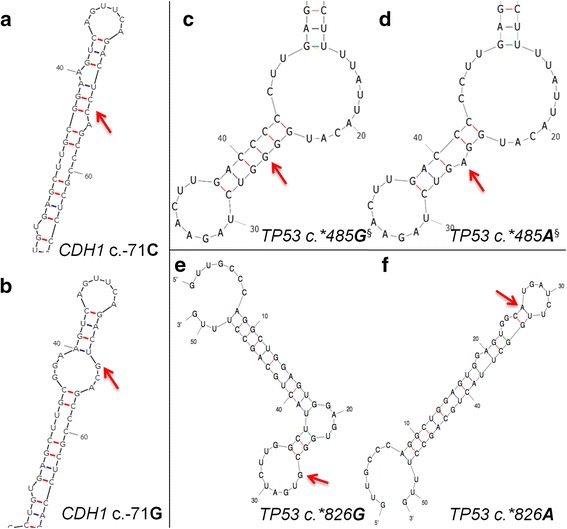
Fig. 5.

Predicted Alteration in UTR Structure Using mFOLD for Variants Flagged by SNPfold. Wild-type and variant structures are displayed, with the variant indicated by a red arrow. a Predicted wild-type structure of CDH1 5’UTR surrounding c.-71. b Predicted CDH1 5’UTR structure due to c.-71C > G variant. c Predicted wild-type TP53 3’UTR structure surrounding c.*485. d Predicted TP53 5’UTR structure due to c.*485G > A variant. e Predicted wild-type TP53 3’UTR structure surrounding c.*826. f Predicted TP53 5’UTR structure due to c.*826G > A variant. §SHAPE analysis revealed differences in reactivity between mutant and variant mRNAs, confirming alterations to 2° structure
