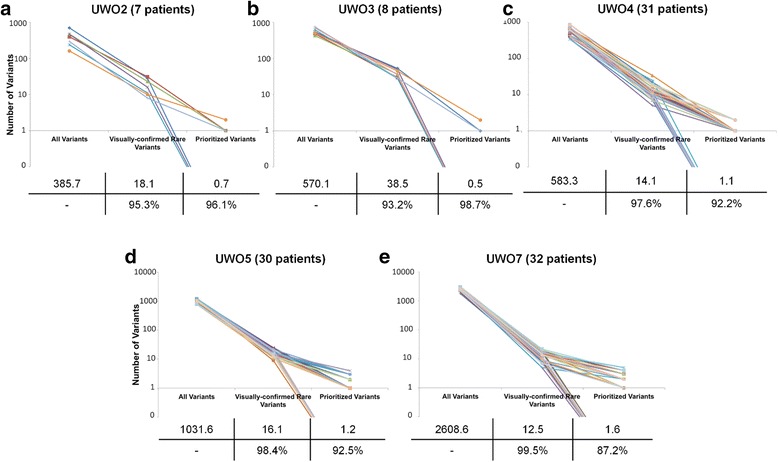
Fig. 6.

Ladder Plot Representing Variant Identification and Prioritization. Each line is representative of a different sample in each sequencing run (a-e), illustrating the number of unique variants at important steps throughout the variant prioritization process. The left-most point indicates the total number of unique variants. The second point represents the number of unique variants remaining after common (>5 patients within cohort and/or ≥ 1.0 % allele frequency) and false-positive variants were removed. The right-most point represents the final number of unique. No variants were prioritized in the following patients: 2-1A, 2-5A, 2-6A, 3-2A, 3-3A, 3-4A, 3-5A, 3-8A, 4-1B, 4-2C, 4-2 F, 4-3B, 4-3D, 4-4B, 4-4E, 5-1G, 5-1H, 5-3D, 5-4C, 5-4D, 5-4 F, 5-4G, 5-4H, 7-1B, 7-1C, 7-1D, 7-1H, 7-2B, 7-2C, 7-2H, 7-3H, 7-4A, 7-4D, 7-4H. The average number of variants per patient at each step is indicated in a table below each plot, along with the percent reduction in variants from one step to another
