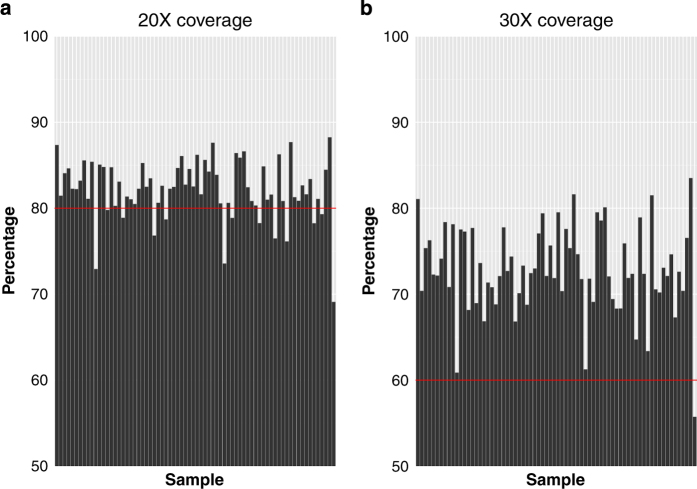
Figure 1. Whole exome sequencing coverage at 20X (left panel) and 30X (right panel) depth.
Each bar on the x-axis represents a single sample and the percentage (starting at 50%) on the y-axis indicates the percentage of bases, out of all sequenced bases, that had at least (a) 20X or (b) 30X coverage. The red lines mark the 80 and 60% percentages.

