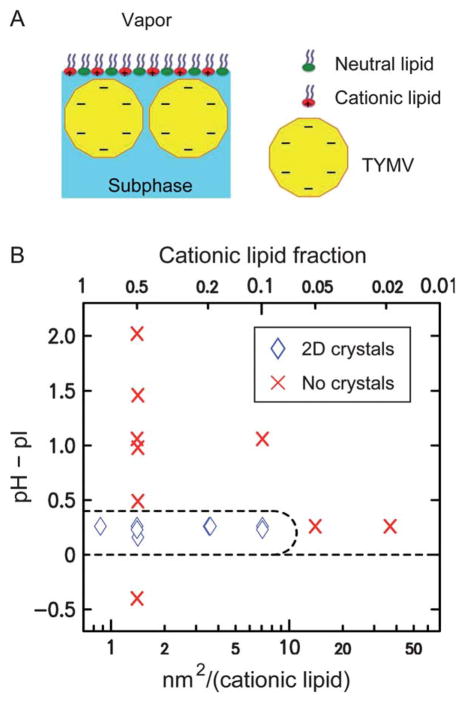
Fig. 2.
(A) A schematic illustrating the assembly of TYMV at the lipid-terminated solution–vapor interface (not drawn to scale). (B) Observed 2D assembly behavior of TYMV as a function of the solution pH relative to pI = 3.6 (see ESI, Fig. S1†) and the area per cationic lipid (bottom abscissa) or the cationic lipid fraction (top). The points at which GISAXS measurements were carried out are indicated by diamonds and crosses, where diamonds represent the observation of GISAXS peaks for the 2D crystals of TYMV.

