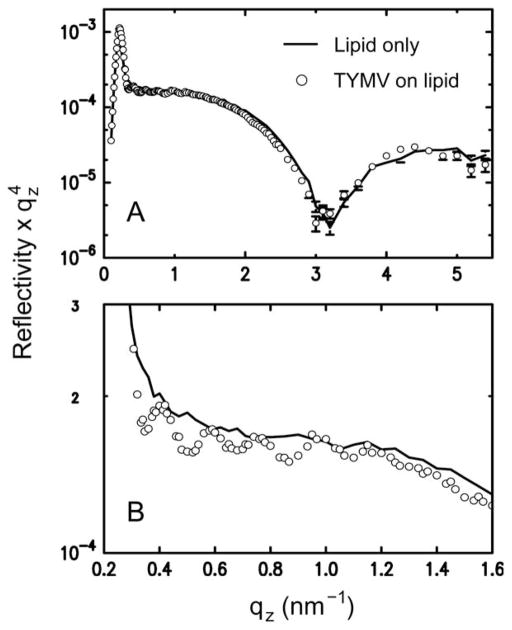
Fig. 4.
(A) Measured XR data from a lipid monolayer (10% cationic lipid) at the surface of a pH 3.9 solution (pH – pI = 0.3) without TYMV (line) and with TYMV (circles; 0.015 mg ml−1), taken under the condition where 2D crystals were observed. (B) The same data sets over a smaller qz range. In the presence of TYMV, the XR curve displays modulations at low qz with a period of Δqz ~ 0.2 nm−1.

