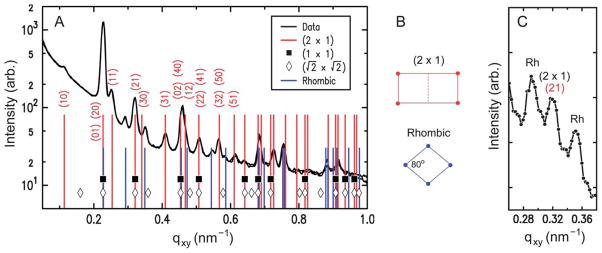
Fig. 5.
(A) Measured GISAXS intensity vs. qxy (integrated over 0.2 ≤ qz ≤ 0.6 nm−1), obtained from 2D crystals of TYMV (pH 3.8, pH – pI = 0.2, cationic lipid fraction = 0.1, 0.015 mg ml−1 TYMV). The tall vertical lines with indices represent the double-square (2 × 1) lattice (a1/2 = a2 = 27.7 nm, γ = 90°). The short vertical lines represent the rhombic lattice ( , γ′ = 80°). The symbols indicate the positions that would be expected for simple square lattices with a = a2 (filled squares) and (diamonds). (B) Unit cells for the (2 × 1) rectangular and rhombic lattices. (C) Measured GISAXS intensity vs. qxy, obtained at a 3 times higher TYMV concentration (pH 3.8, pH – pI = 0.2, cationic lipid fraction = 0.5, 0.045 mg ml−1 TYMV). The central peak is the (21) peak from the (2 × 1) rectangular lattice, and the adjacent “Rh” peaks are from the rhombic lattice.

